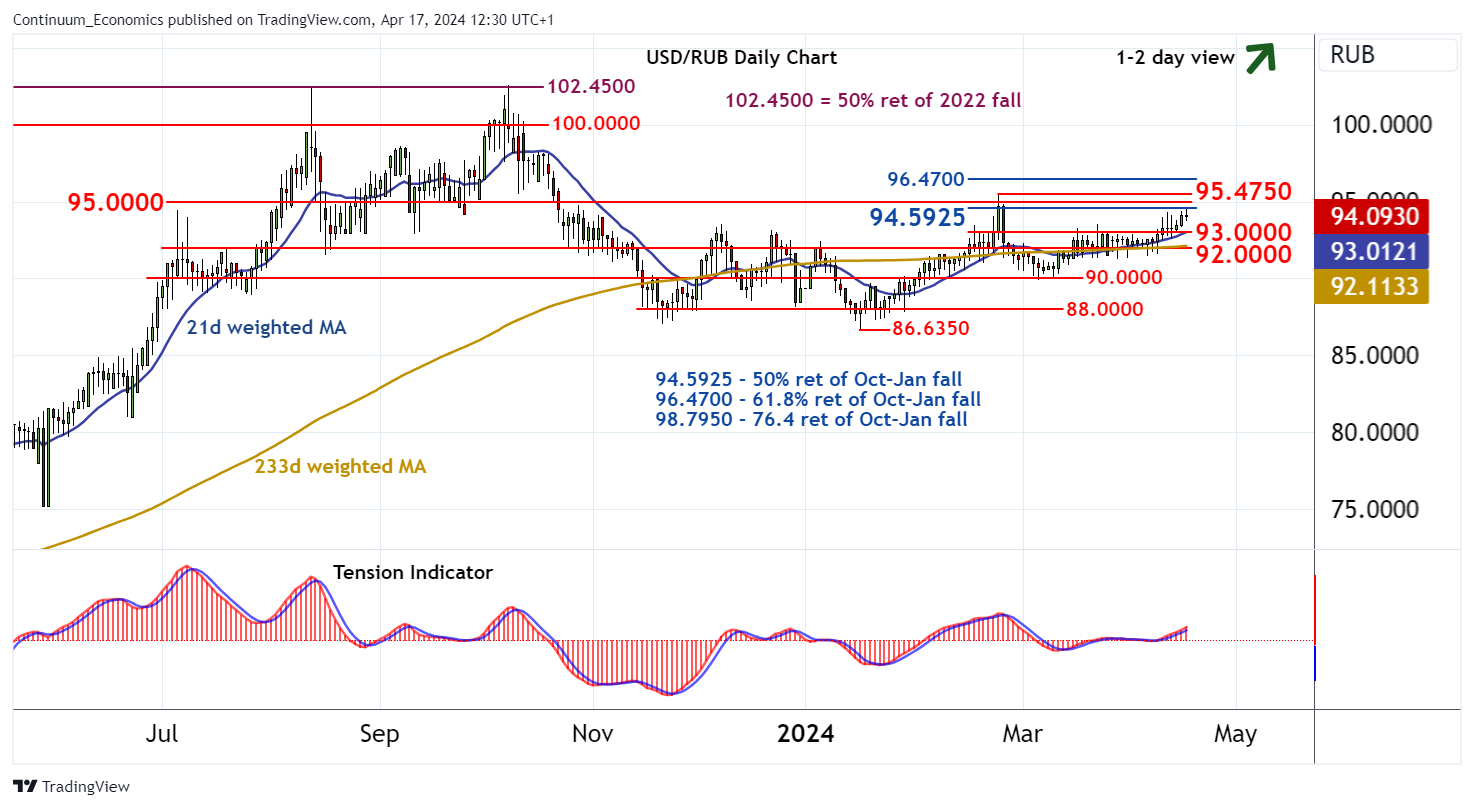
Chart USD/RUB Update: Edging higher - critical resistance at 95.4750

Anticipated gains have reached initial resistance at the 94.5925 Fibonacci retracement
| Levels | Comment | Levels | Comment | |||||
| R4 | 96.0000 | * | congestion | S1 | 93.0000 | * | congestion | |
| R3 | 95.4750 | * | 23 Feb YTD high | S2 | 92.0000 | * | congestion | |
| R2 | 95.0000 | ** | congestion | S3 | 90.0000 | * | congestion | |
| R1 | 94.5925 | ** | 50% ret of Oct-Jan fall | S4 | 88.0000 | * | congestion |
Asterisk denotes strength of level
12:25 BST - Anticipated gains have reached initial resistance at the 94.5925 Fibonacci retracement, where short-term consolidation is developing. Just higher are congestion around 95.0000 and the 95.4750 current year high of 23 February. However, already overbought daily stochastics are expected to limit any initial tests of this area in consolidation, before the rising daily Tension Indicator and improving weekly charts prompt a break. A later close above 95.4750 will turn sentiment outright positive and extend January gains towards the 96.4700 retracement. Meanwhile, support is raised to congestion around 93.0000 and extends to 92.0000. This area should underpin any immediate setbacks.