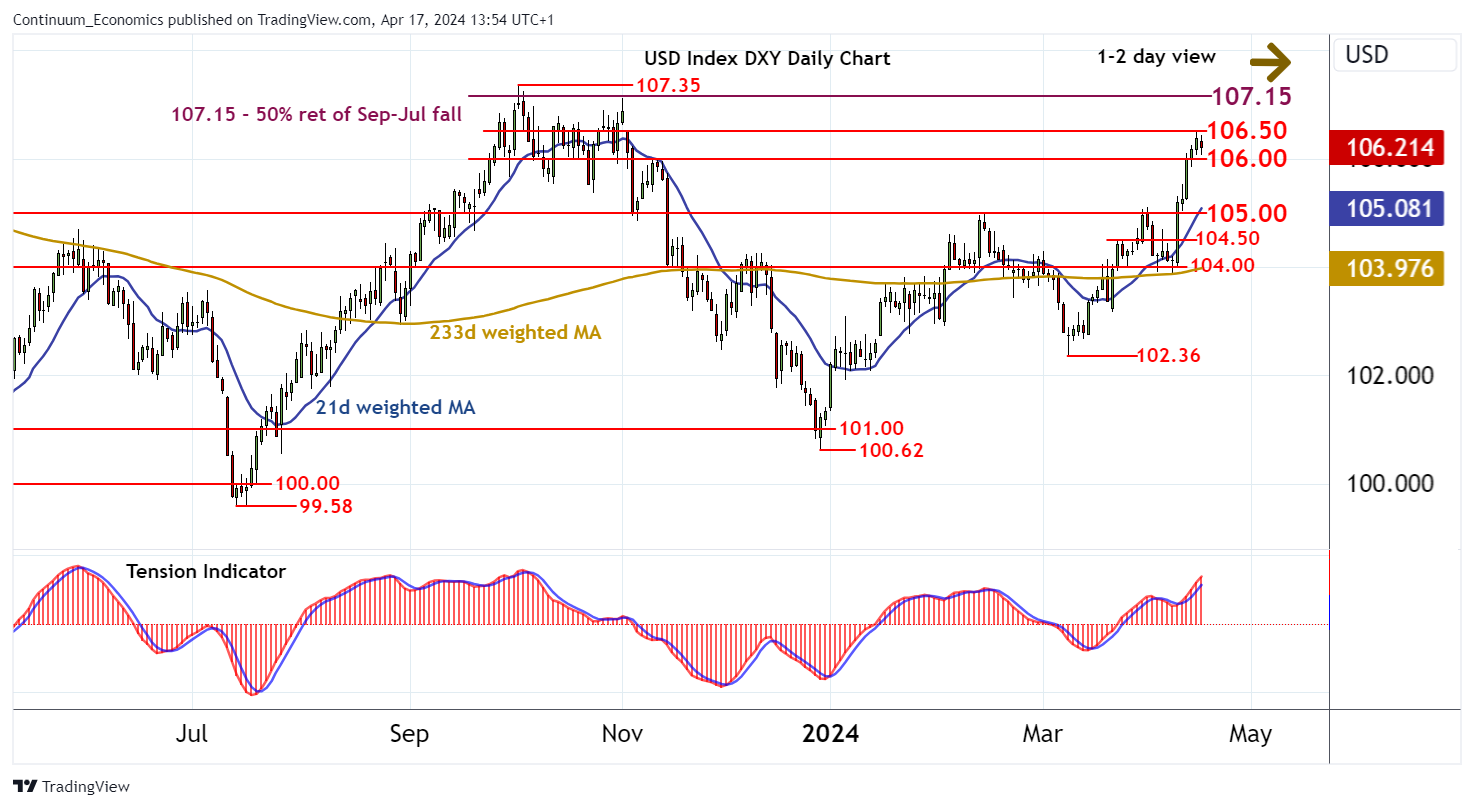
Chart USD Index DXY Update: Balanced at current year highs - studies turning down

Little change, as prices extend consolidation at current year highs
| Levels | Imp | Comment | Levels | Imp | Comment | |||
|---|---|---|---|---|---|---|---|---|
| R4 | 109.00 | ** | 61.8% ret of Sep-Jul fall | S1 | 106.00 | ** | congestion | |
| R3 | 108.00 | * | congestion | S2 | 105.00 | ** | break level | |
| R2 | 107.15/35 | ** | 50% ret of Sep-Jul fall; 3 Oct 2023 (y) high | S3 | 104.50 | break level | ||
| R1 | 106.50 | * | congestion | S4 | 104.00 | * | congestion |
Asterisk denotes strength of level
13:35 BST - Little change, as prices extend consolidation at current year highs above congestion support at 106.00. Overbought daily stochastics are turning down and overbought weekly stochastics are flattening, suggesting potential for a test beneath here. Swift losses will then focus on 105.00, but the rising daily Tension Indicator is expected to limit any initial tests of here in fresh consolidation. Meanwhile, resistance remains at 106.50. A close above here, if seen, will turn sentiment cautiously positive and extend late-December gains towards critical resistance within 107.15/35, where more significant profit-taking is expected to appear.