Chart USD/JPY Update: Balanced at 34-year highs - bullish daily studies fading

Little change in trade, as prices extend consolidation beneath the 154.79 current year high
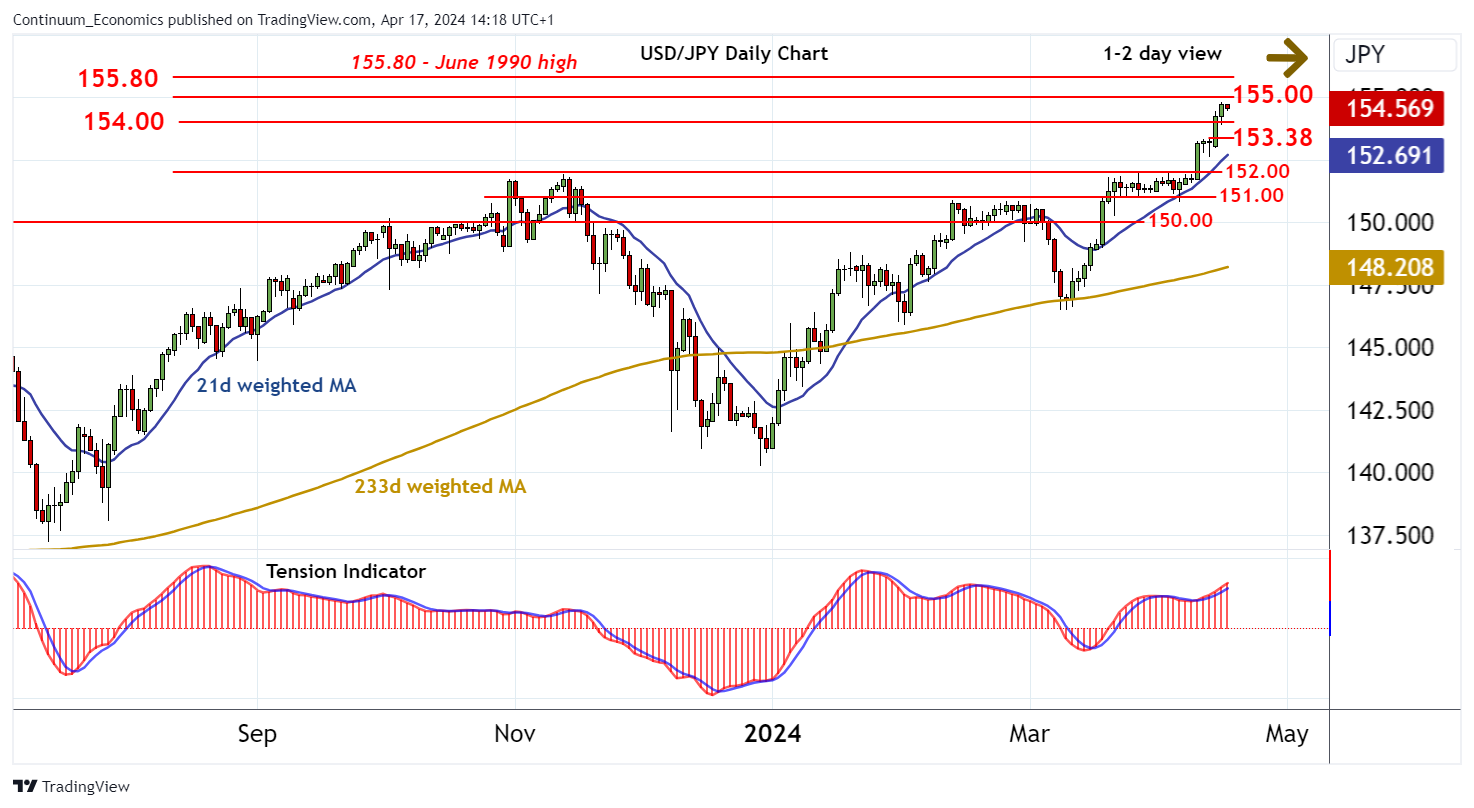
| Levels | Imp | Comment | Levels | Imp | Comment | |||
|---|---|---|---|---|---|---|---|---|
| R4 | 156.00 | figure | S1 | 154.00 | figure | |||
| R3 | 155.80 | ** | June 1990 high | S2 | 153.38 | * | 12 Apr (w) high | |
| R2 | 155.00 | * | figure | S3 | 152.00 | * | break level | |
| R1 | 154.79 | * | 16 Apr YTD high | S4 | 151.00 | * | congestion |
Asterisk denotes strength of level
13:55 BST - Little change in trade, as prices extend consolidation beneath the 154.79 current year high. Overbought daily stochastics are unwinding, suggesting room for a pullback towards 154.00. However, the rising daily Tension Indicator and positive weekly charts are expected to limit any break in fresh buying interest towards the 153.38 weekly high of 12 April. A close beneath here, if seen, will turn sentiment negative and prompt a deeper reaction towards 152.00. Meanwhile, resistance remains at 155.00. A break above here, if seen, will extend gains to the 155.80 high of June 1990, where already overbought weekly stochastics could promote profit-taking/consolidation.