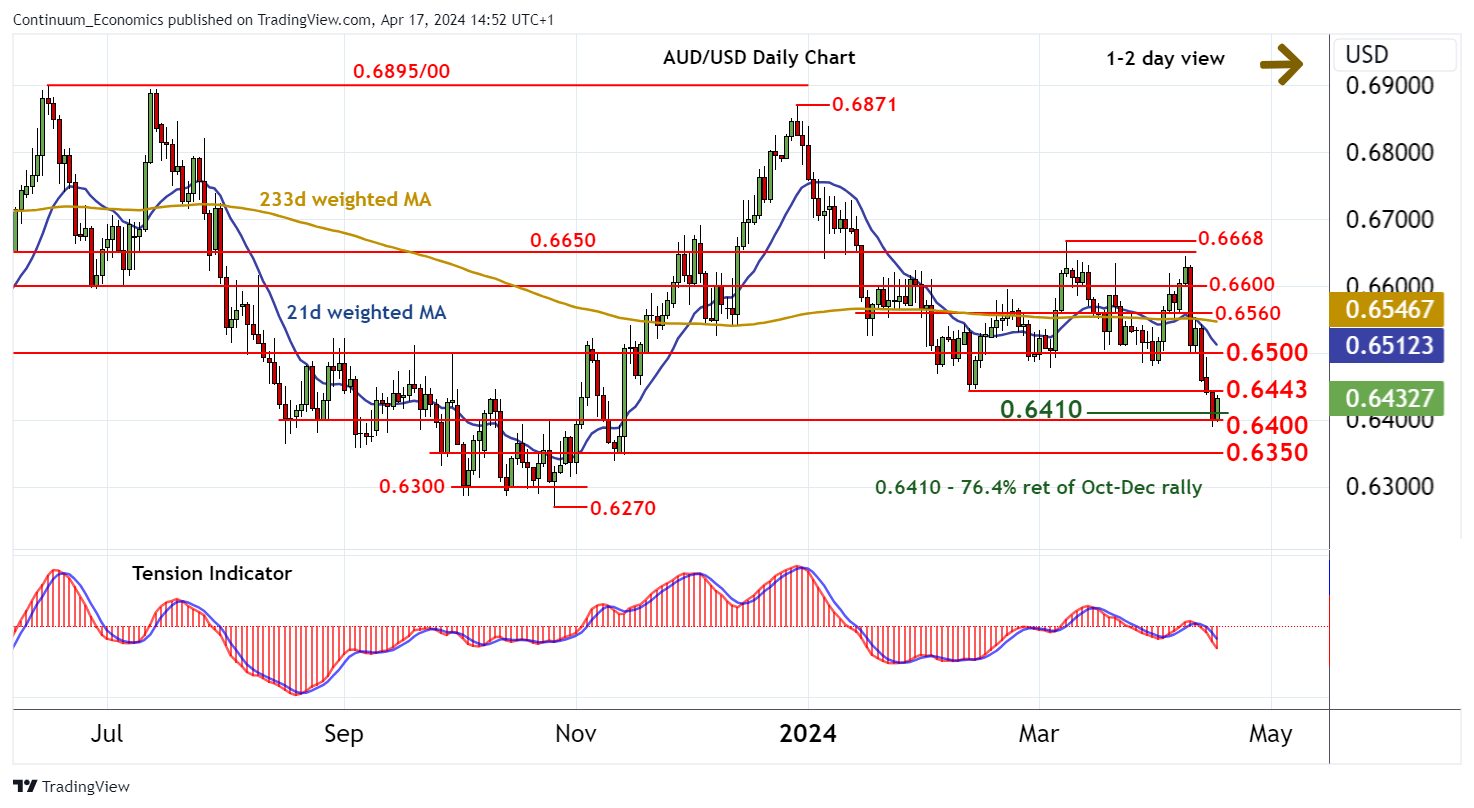
Chart AUD/USD Update: Consolidating test of support at 0.6400/10

The anticipated continuation below strong support at congestion around 0.6400 and the 0.6410 Fibonacci retracement has not been seen
| Levels | Imp | Comment | Levels | Imp | Comment | |||
|---|---|---|---|---|---|---|---|---|
| R4 | 0.6600 | * | congestion | S1 | 0.6400/10 | ** | congestion; 76.4% ret of Oct-Dec rally | |
| R3 | 0.6560 | * | break level | S2 | 0.6350 | * | congestion | |
| R2 | 0.6500 | * | congestion | S3 | 0.6300 | * | congestion | |
| R1 | 0.6443 | ** | 13 Feb (m) low | S4 | 0.6270 | ** | 26 Oct 2023 (y) low | |
Asterisk denotes strength of level
14:40 BST - The anticipated continuation below strong support at congestion around 0.6400 and the 0.6410 Fibonacci retracement has not been seen, as rising intraday studies and a tick higher in oversold daily stochastics prompt short-covering. Immediate focus is turning to the 0.6443 monthly low of 13 February, but the negative daily Tension Indicator and mixed/negative weekly charts are expected to limit any initial tests in further consolidation. A close above here, however, will improve price action and delay downside development, as prices then settle into consolidation beneath congestion around 0.6500. Meanwhile, a close below 0.6400/10, not yet seen, will add fresh weight to sentiment and extend late-December losses towards congestion around 0.6350. However, flattening oversold weekly stochastics are expected to limit any initial tests in short-covering/consolidation.