Chart USD/MXN Update: Smart gains balanced beneath the 17.1200 Fibonacci retracement

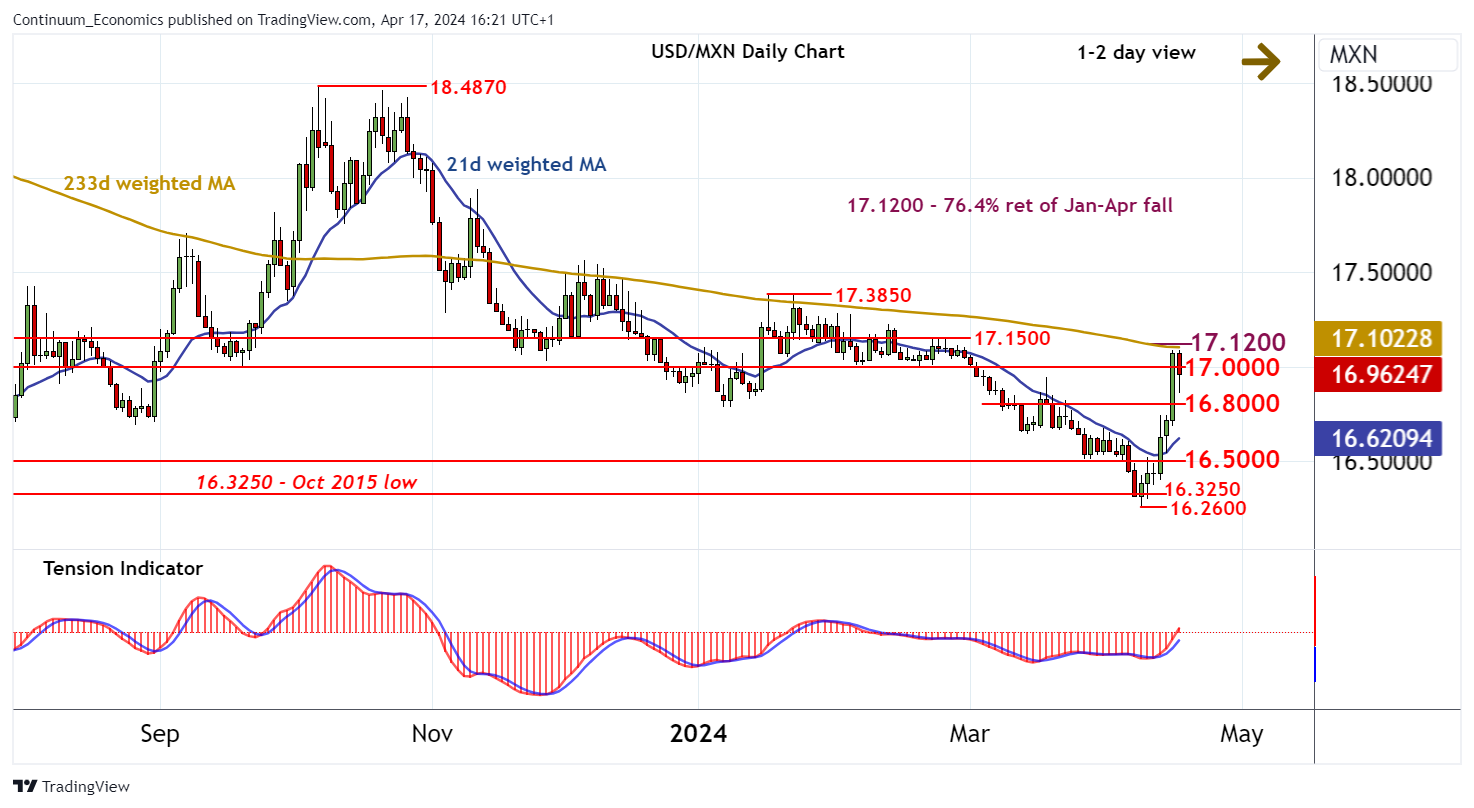
The smart bounce from the 9-year lows at 16.2600 is meeting selling interest just beneath strong resistance at the 17.1200 Fibonacci retracement
| Levels | Imp | Comment | Levels | Imp | Comment | |||
|---|---|---|---|---|---|---|---|---|
| R4 | 17.1500 | * | congestion | S1 | 16.8000 | * | break level | |
| R3 | 17.1200 | ** | 76.4% ret of Jan-Apr fall | S2 | 16.5000 | ** | congestion | |
| R2 | 17.0850 | 16 Apr high | S3 | 16.3250 | ** | Oct 2015 low | ||
| R1 | 17.0000 | congestion | S4 | 16.2600 | ** | 9 Apr YTD low |
Asterisk denotes strength of level
16:15 BST - The smart bounce from the 9-year lows at 16.2600 is meeting selling interest just beneath strong resistance at the 17.1200 Fibonacci retracement. Overbought daily stochastics are flattening, suggesting room for a pullback in the coming sessions, with focus to turn to 16.8000. The rising daily Tension Indicator and improving weekly readings are expected to limit any tests in fresh buying interest. However, further slippage, if seen, should meet buying interest towards congestion support at 16.5000. Following any corrective trade, fresh gains are looked for. A later close above 17.1200 will improve sentiment and open up the 17.3850 current year high of 17 January.